
The COVID-19 pandemic has fundamentally changed how most commonplace activities are carried out. There’s still a lot of uncertainty out there. Property managers nationwide grapple with managing teams remotely, entertaining locked-down residents and now, just trying to collect rent. At Rentbot, we’ve been working hard with clients during this time in any way we can to adjust their Google Ad campaigns as well as monitor their website traffic.
Our approach
In mid March, Yardi reported that RENTCafe.com saw a 25% drop in the number of sessions in a week. With the situation changing so rapidly, I thought it might be interesting and helpful to dig into some of our Rentbot data. But instead of just looking at a week’s worth of data, I wanted to check out all of March to see what trends emerged.
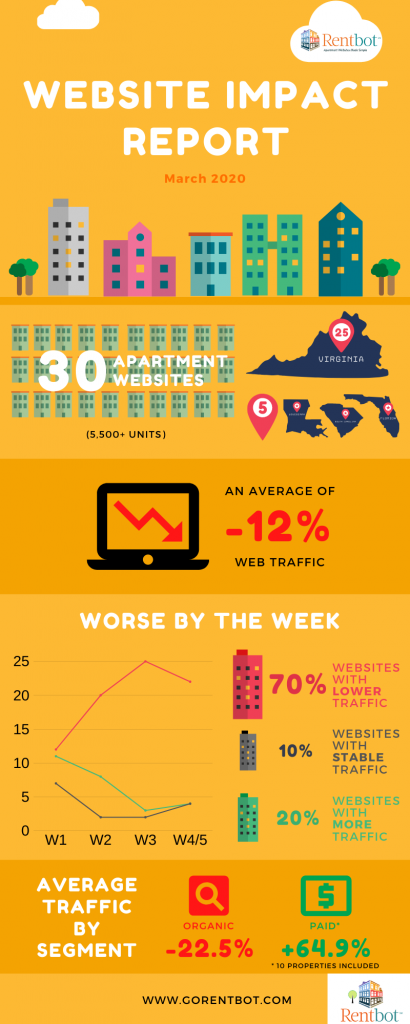
So reflected in the infographic and statistics mentioned here is data for thirty (30) property websites. In order to get the clearest sense possible of what’s truly going on, we only included websites that have been around for at least a year. We wanted to compare year-over-year data and see how website sessions in March 2019 (oh remember that blissful time?) compared with March 2020.
Website traffic is down 12%
Overall, the picture we see is a different kind of March Madness than we’d been hoping for at the start of the year. Across the thirty properties, website traffic was down this year by 12% over last year’s March. This is especially grim, since this is just the start of multifamily’s busy season.
Here’s a closer look at how the thirty properties fared:
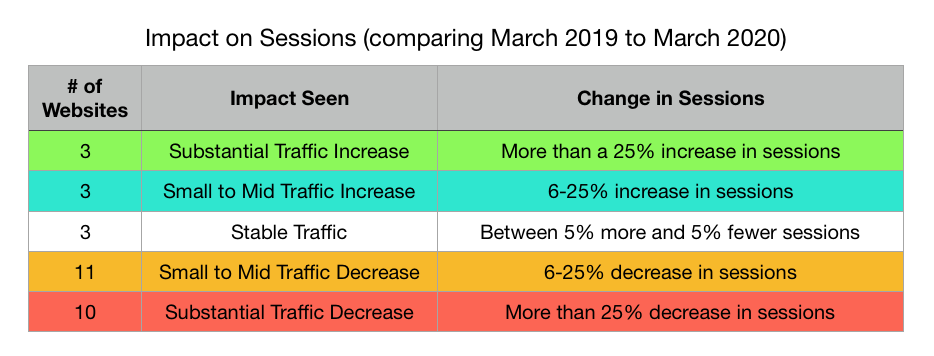
From this, we do see that 30% of the properties in our study had either stable traffic or an increase. But for those of you good at math, you know that means…
70% of websites had worse traffic this March
Looking at the beginning of March, we actually see a pretty even start. In Week 1 we saw:
- 11 properties with some level of traffic increase (more than 6% increase in sessions)
- 7 properties with stable traffic (+/- 5% compared to 2019)
- 12 properties with some amount of decrease (more than 6% decrease in sessions)
But by Week 3, the picture looked starkly different:
- 3 properties with some level of traffic increase (more than 6% increase in sessions)
- 2 properties with stable traffic (+/- 5% compared to 2019)
- 25 properties with some amount of decrease (more than 6% decrease in sessions)
At the end of the month, we see a glimmer of hope with Weeks 4 and 5 (which is a partial week). There were fewer properties with substantially fewer sessions (greater than -25%) and even some who stabilized or made small gains. Hopefully we see a continuation of this trend into April.
You’re probably wondering how best to break down the data for your own property’s website. To provide that help, we’ll first need to look a little closer into the different types of traffic. Just like leads, all website traffic is not created equal.
Organic traffic performs worse & Google Ads provide traffic boost
Organic traffic is comprised of visitors getting to your website after typing something into a search engine and clicking on a link to your property website. This costs you nothing, and is what SEO (search engine optimization) aims to improve. We saw a decline of 22.5% when just looking at organic traffic!
Now paid traffic, on the other hand, did remarkably better. When we say “paid traffic,” we are referring to Google Ad campaigns. These also show up on Google’s search results pages – typically one to four at the very top – and they do cost money. For the ten properties we were able to evaluate, we saw an improvement of nearly 65% this month against last year’s sessions! This is fantastic and a great reminder that there are tools at your disposal to still generate interest and promote awareness of your property.
Please note:
- Twenty of this study’s properties were either not running Google Ads or were, but not for long enough to provide year over year data.
- We have not yet looked into the other major channels of website traffic, including Social (visitors coming from Facebook, Instagram, etc.), Direct (visitors coming from typing your website URL into the browser or via a bookmark), and Referral (visitors coming from another website that links to yours).
What can you do?
By nature, I have an optimistic attitude and outlook. So I knew that instead of simply presenting “bad news,” I wanted to provide some hope and some help!
- Don’t freak out. This is not lead data or lease data. It’s website sessions. But website traffic is an indicator that can help you understand (and course improve) your property’s digital presence. This is especially important when your “drive by” leads are at the corner of Google and Bing.
- Don’t abandon ship. Budgets planned at the end of 2019 were likely already tight. Now they are in chaos. But please don’t forget that from this tumultuous time, if you can find ways to continue marketing – especially digitally – you will see your way through with minimized vacancies.
- Ask for help. Seriously. Ask your tenants to work with you to continue paying rent – even if not the full amount right now. Ask your fellow property managers for their ideas and methods for navigating this unprecedented situation. And please, ask us for help. Rentbot prides itself on working with small to medium size properties and portfolios to provide affordable digital marketing (Google Ads and SEO) as well as websites with built-in online payment!
If you have any questions about your property’s digital presence, how to get a quick, affordable online payment portal, or any of this data, please contact me directly.
Post and Infographic Attribution
We truly hope you find this information helpful and actionable as the entire industry reassesses what to do moving forward.
You are encouraged to share, reuse, reference or repost the image in this article. When doing so, please link back to either www.GoRentbot.com or this blog post directly. That way, those seeing it can learn more about this study, the research that went into it and our methodology. Thanks!
Additional Demographic Data
Here’s a breakdown to give you a better sense of the properties included in Rentbot’s study.
- Location: 25 Virginia & 5 non-VA
- Property Type: 26 Conventional & 4 Tax Credit
- Class: 11 Class A & 19 Class B/C